Working as a data analyst, you quickly find out that real-world data is never clean, and even after the arduous process of cleaning it, you have to put a lot of effort into gleaning actionable insights from the data. This is where Dax (Data Analysis Expressions) becomes invaluable.
DAX empowers analysts to build dynamic measures, perform complex calculations, and unlock deeper layers of understanding from their data. In this article, I’ll walk you through 12 critical DAX measures that formed the foundation of a Product Performance Dashboard I built using Power BI. These examples not only showcase essential business KPIs but also offer insight into how DAX works and how it can be used to solve real-world analytical problems. We’ll also demonstrate each measure in Power BI, with screenshots to help you visualize how they come to life in a real dashboard.
DAX expressions are used in tools like Power BI, Excel Power Pivot, and SQL Server Analysis Services to create custom calculations for data models. In Power BI, you can use DAX to build measures, calculated columns, and even calculated tables that make your reports dynamic and context-aware.
Total
To enter a DAX expression in Power BI, open your data model in Power BI Desktop. If you want to create a measure, select the table where you want it, click on “New Measure” in the ribbon, and type your formula in the formula bar.
The Sum function adds up all numeric values in a single column.
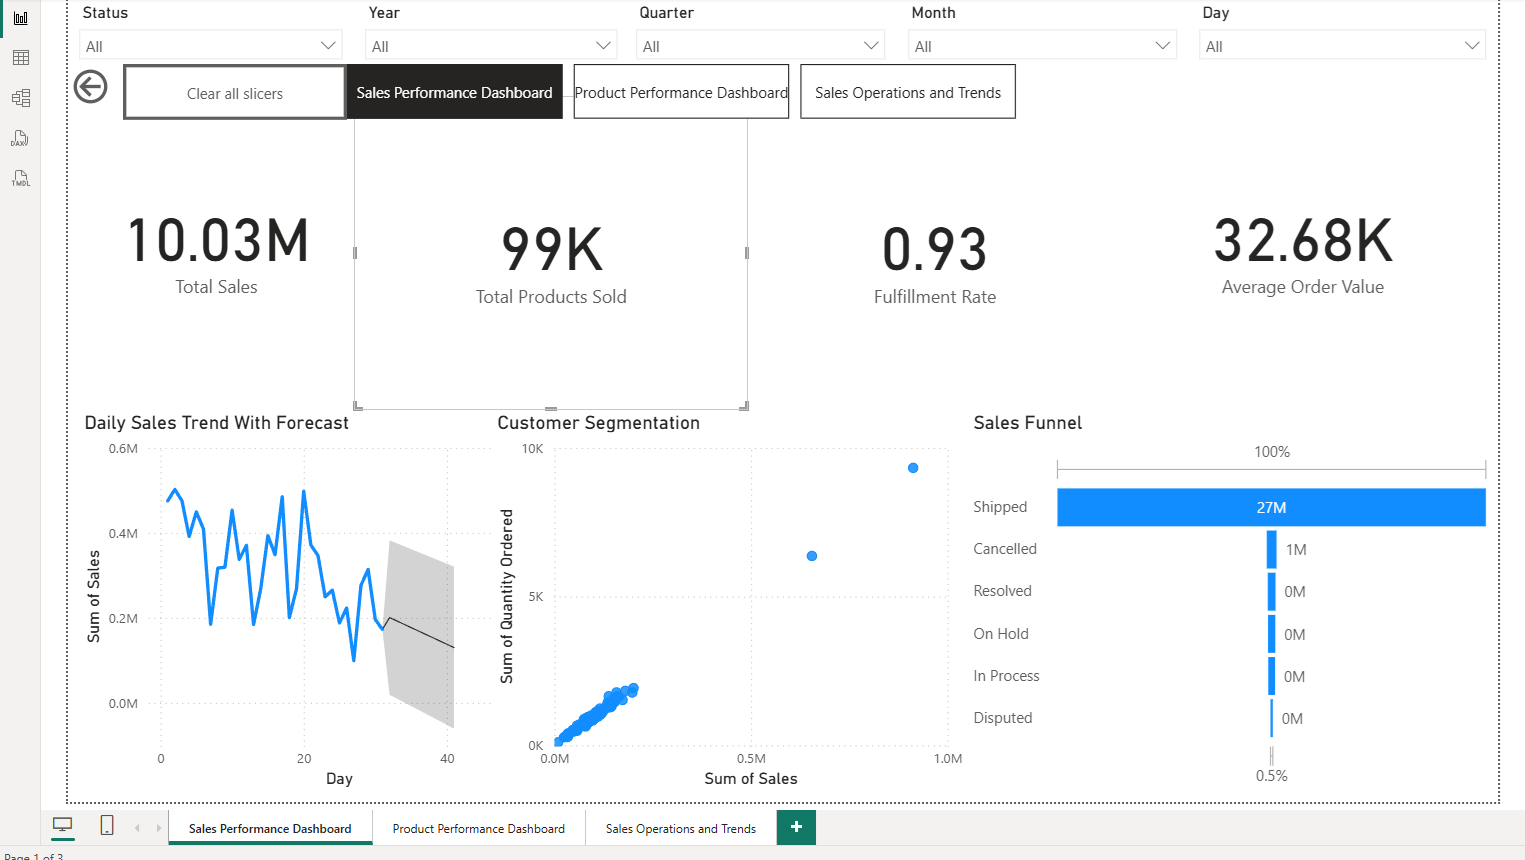
Total Sales = SUM(Sales[Amount])Fulfillment Rate
Fulfillment Rate measures the percentage of orders that were successfully fulfilled out of the total orders placed. It’s a key operational KPI that reflects how well your business is delivering on customer expectations.
If you have a column like “Status” that indicates whether an order was fulfilled (e.g., values like “Shipped” or “Resolved”), you can easily calculate the fulfillment rate.
Fulfillment Rate =
DIVIDE(
    CALCULATE(COUNTROWS(sales_data_sample), sales_data_sample[STATUS] = "Shipped"),
    COUNTROWS(sales_data_sample),
    0
)COUNTROWS(sales_data_sample)counts all orders.CALCULATE(..., sales_data_sample[STATUS] = "Shipped")counts only the fulfilled orders.DIVIDE(...)calculates the percentage, safely handling division by zero.
You can adjust “Shipped” to match the actual status values in your dataset that indicate fulfillment.
Average Order Value
Average Order Value (AOV) is calculated by dividing total sales by the number of orders. It helps businesses understand customer purchasing behavior and evaluate the effectiveness of pricing and upselling strategies.
Average Order Value = DIVIDE(SUM(sales_data_sample[SALES]), COUNT(sales_data_sample[ORDERNUMBER]))SUM(sales_data_sample[SALES])
This part calculates the total revenue from all sales. It adds up the values in theSALEScolumn of your dataset.COUNT(sales_data_sample[ORDERNUMBER])
This counts the total number of orders. Each uniqueORDERNUMBERrepresents one order placed by a customer.DIVIDE(...)
TheDIVIDEfunction safely divides the total sales by the number of orders. It’s preferred over the/operator because it handles division by zero gracefully (returns blank instead of an error).
Average Price Per Product
By dividing total sales revenue by the total quantity of products sold, you get a clear view of how much, on average, each unit is being sold for.
Average Price Per Product = DIVIDE(SUM(sales_data_sample[SALES]), SUM(sales_data_sample[QUANTITYORDERED]))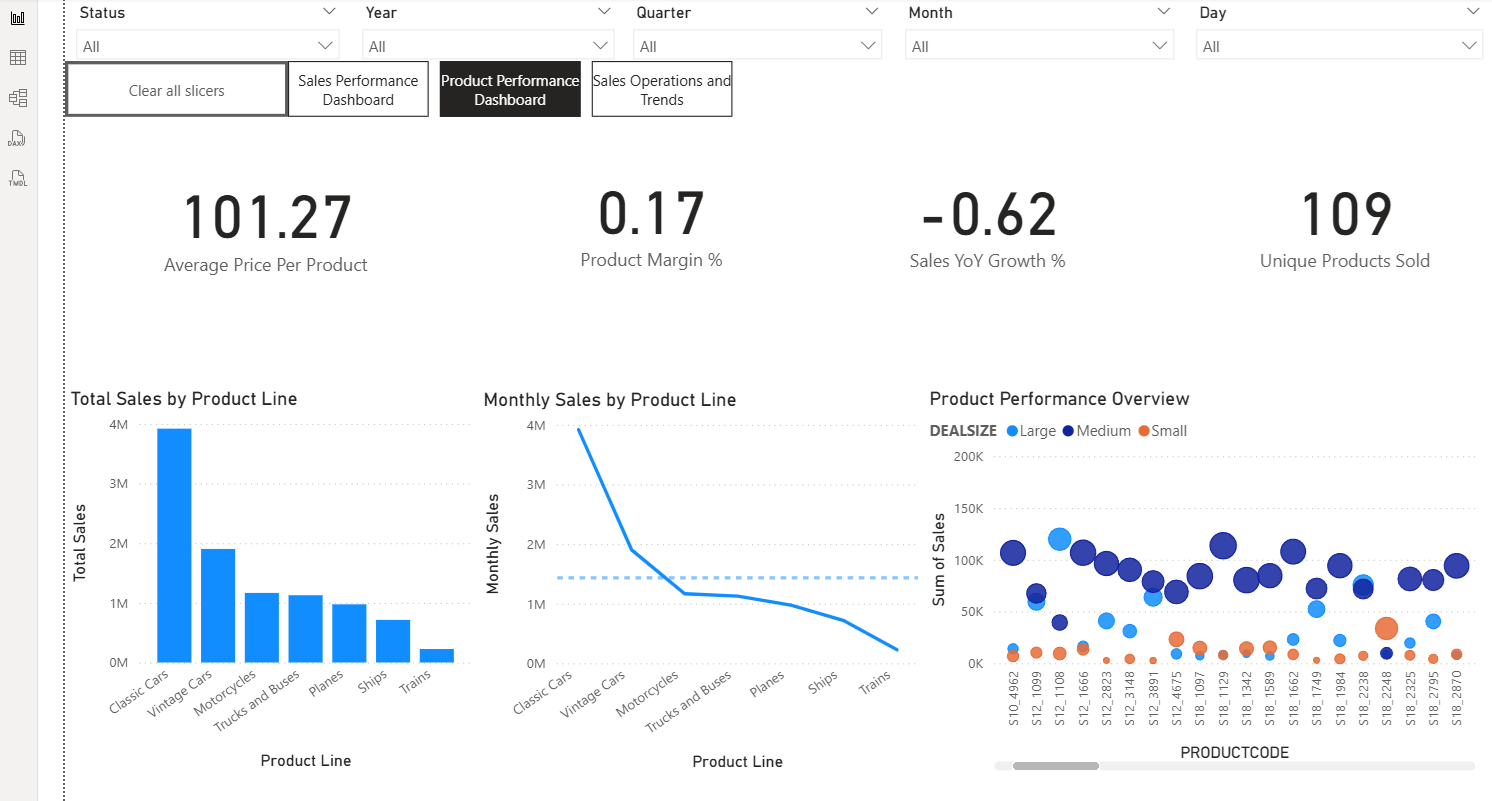
Product Margin
Calculating product margin enables businesses to assess the profit they make on each item relative to its suggested retail price, highlighting which products contribute most to the bottom line.
which products contribute most to the bottom line.
Product Margin % =
AVERAGEX(
    VALUES(sales_data_sample[PRODUCTCODE]),
    DIVIDE(
        (AVERAGE(sales_data_sample[MSRP]) - AVERAGE(sales_data_sample[PRICEEACH])),
        AVERAGE(sales_data_sample[MSRP])
    )
)
VALUES(sales_data_sample[PRODUCTCODE])
This returns a distinct list of product codes from thesales_data_sampletable. It ensures that the calculation is done per product, not across the entire dataset.AVERAGEX(...)
This is an iterator function that iterates over the distinct product codes row by row and calculates the average of the expression within it. It’s ideal for row-context-aware calculations
Inside the iterator:
AVERAGE(sales_data_sample[MSRP]): Calculates the average Manufacturer’s Suggested Retail Price for each product.AVERAGE(sales_data_sample[PRICEEACH]): Calculates the average actual selling price for each product.DIVIDE(...): Safely divides the difference between MSRP and actual price by MSRP to get themargin percentage.DIVIDEhandles divide-by-zero errors gracefully.
Year over Year Sales Growth
Year-over-year (YoY) sales growth is a key performance indicator that helps businesses evaluate how their revenue is trending over time.
Sales YoY Growth % =
VAR CurrentYearSales =
    CALCULATE(
        SUM(sales_data_sample[SALES]),
        sales_data_sample[YEAR_ID] = MAX(sales_data_sample[YEAR_ID])
    )
VAR LastYearSales =
    CALCULATE(
        SUM(sales_data_sample[SALES]),
        sales_data_sample[YEAR_ID] = MAX(sales_data_sample[YEAR_ID]) - 1
    )
RETURN
DIVIDE(CurrentYearSales - LastYearSales, LastYearSales, 0)- VAR CurrentYearSales: Stores the total sales for the current year. It uses
CALCULATEto sum theSALEScolumn where theYEAR_IDmatches the latest year in the current filter context (determined byMAX(sales_data_sample[YEAR_ID])). - VAR LastYearSales:Stores the total sales for the previous year. It also uses
CALCULATE, but filters for one year before the current year by subtracting 1 from the maximumYEAR_ID - CALCULATE(…) Evaluates an expression in a modified filter context. In this case, it calculates total sales for a specific year by applying a filter directly inside the function.
- MAX(sales_data_sample[YEAR_ID])Returns the highest year value in the current context, which is assumed to be the most recent year in the dataset or visual.
- DIVIDE(…)Safely divides the difference between current year sales and last year sales by last year sales to get the growth percentage. The third argument (
0) ensures that if last year’s sales are zero, the formula returns zero instead of an error.
.
Unique Products Sold
This measure is important because it identifies the single best-performing product based on total sales, helping businesses quickly recognize which item is driving the most revenue.
Top Product by Total Sales =
CALCULATE(
    MAX(sales_data_sample[PRODUCTCODE]),
    TOPN(
        1,
        SUMMARIZE(
            sales_data_sample,
            sales_data_sample[PRODUCTCODE],
            "TotalSales",
            SUM(sales_data_sample[SALES])
        ),
        [TotalSales],
        DESC
    )
)- CALCULATE(…):Evaluates an expression in a modified filter context. In this case, it returns the product code with the highest total sales.
- MAX(sales_data_sample[PRODUCTCODE]): Returns the maximum (alphabetically last) product code from the filtered result. Since CALCULATE is used with TOPN, this will return the product code of the top-selling product.
- TOPN(1, …, [TotalSales], DESC): Returns the top 1 row from a table, ordered by the TotalSales column in descending order. This ensures that only the product with the highest sales is selected.
- SUMMARIZE(…): Creates a temporary table that groups the data by PRODUCTCODE and calculates the total sales for each product. It adds a new column called “TotalSales” using SUM(sales_data_sample[SALES]).
Top Product Line by Sales
This measure helps identify which product lines are contributing the most to overall revenue. By focusing on the top sellers, businesses can prioritize resources, marketing efforts, and inventory planning around their most successful categories. It also enables executives and analysts to quickly assess which segments are driving growth, making it a valuable component of any sales performance dashboard.
Top Product Line by Sales =
CALCULATE(
    SUM(sales_data_sample[SALES]),
    TOPN(
        5,
        VALUES(sales_data_sample[Product Line]),
        CALCULATE(SUM(sales_data_sample[SALES])),
        DESC
    )
)
Conclusion
There are many more possible measures we can cover, but this should give you some insight into DAX’s relatively simple syntax. Once you have that, you can customize these expressions to solve whatever business problem you are currently working on. DAX allows analysts to go beyond simple aggregations and create measures that respond to context, adapt to filters, and uncover patterns hidden in the data. Whether you’re calculating totals, building ratios, or modeling complex business logic, DAX gives you the flexibility to turn raw numbers into meaningful insights.