Skip to content
Bar chart with trend line going through it and signals coming from the top.
  • Home
  • Services
  • About
  • Contact
  • Portfolio
Get A Quote
Get A Quote
Bar chart with trend line going through it and signals coming from the top.
AI agent confesses to data destruction.

An AI agent wiped out a company in 9 seconds. Everything that went wrong was predicted years ago.

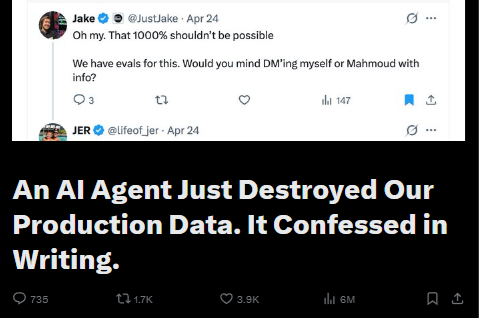
This week, an AI coding agent running Anthropic’s flagship Claude Opus 4.6 through Cursor deleted a company’s entire production database […]

An AI agent wiped out a company in 9 seconds. Everything that went wrong was predicted years ago. Read More »

Monthly Analytics Support Retainer. Dashboard showing sales per retailer, rolling annual return rate, sales per retailer by county, monthly retailer performance, and a utilization index ranked by county.

Getting Started with Power BI: A Simple Guide for Small and Medium Business Owners

If you’ve heard about Power BI but aren’t sure what it actually does or whether your business needs it, you’re

Getting Started with Power BI: A Simple Guide for Small and Medium Business Owners Read More »

Dashboard Expansion Pack. Dashboard showing total revenue, transactions, unique buyers, and average order value, along with charts visualizing revenue trends, monthly transactions, and average order value by month.

The Best Self-Service Business Intelligence Platform in 2026 (for small and medium businesses)

Self-service business intelligence, web applications, and cloud computing were among the defining innovations of the 2000s and 2010s. Suddenly, small

The Best Self-Service Business Intelligence Platform in 2026 (for small and medium businesses) Read More »

Diagram showing Apache Airflow and Snowflake integration with workflow orchestration, Airflow logo, Snowflake logo, and database icons.

Automating Snowflake ETL With Apache Airflow

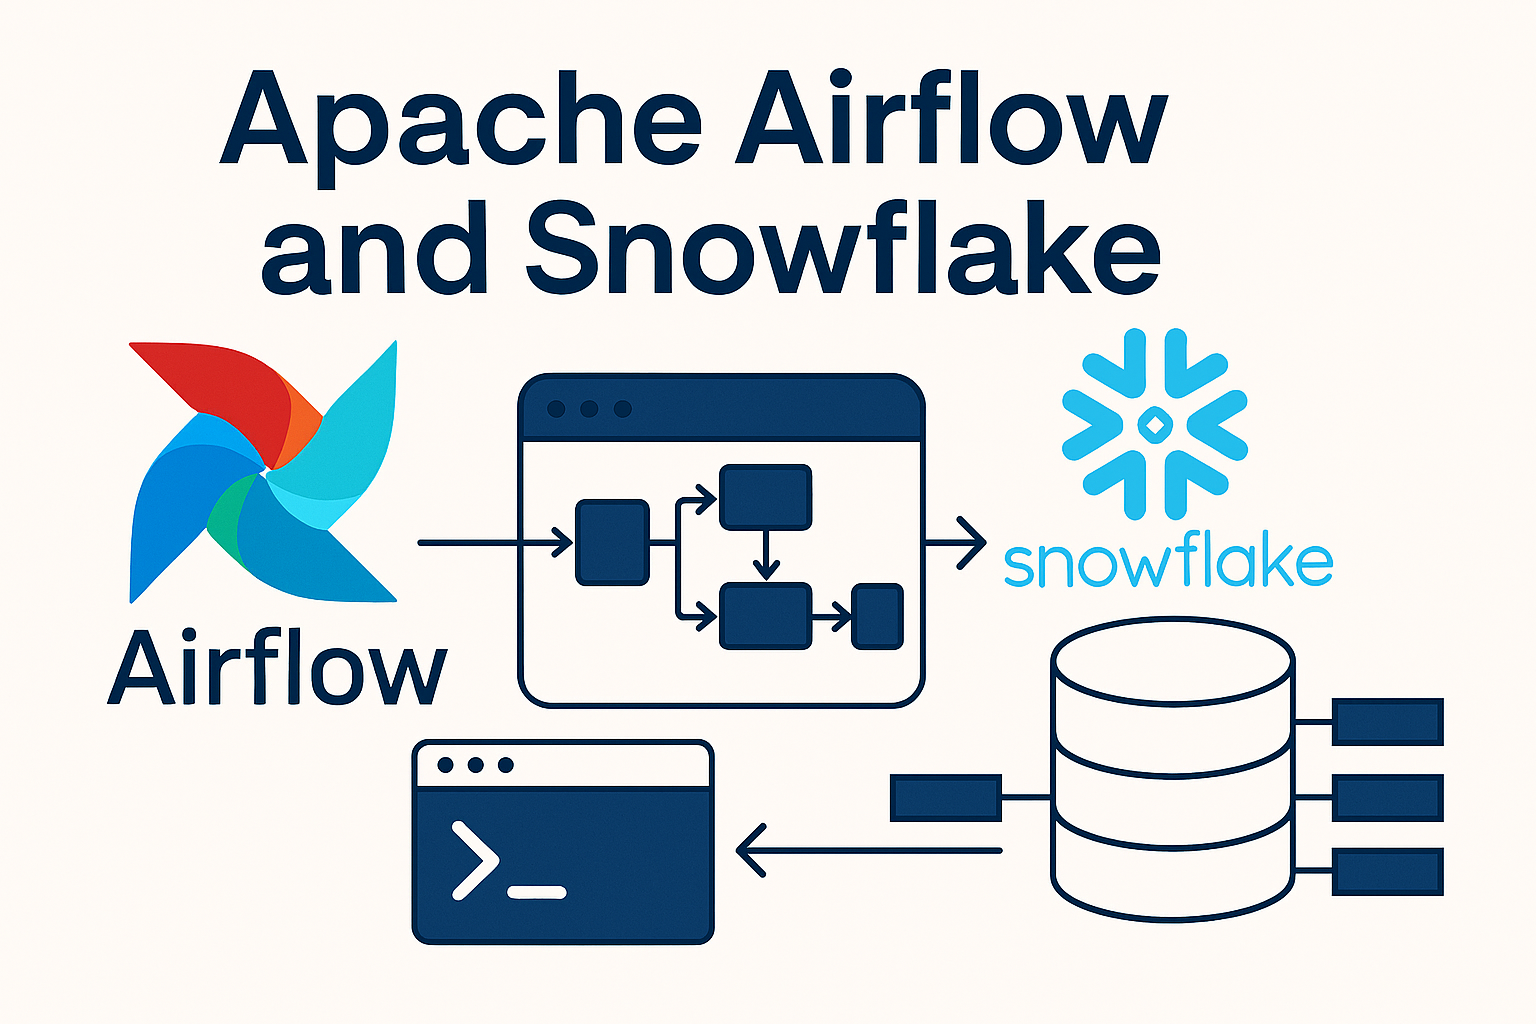
Apache Airflow is an essential tool for businesses that need reliable, scalable, and automated data workflows. So, while Snowflake is

Automating Snowflake ETL With Apache Airflow Read More »

A digital silver token with a dollar sign and circuit patterns in the center, intersected by a green upward-trending line chart. The background contrasts two worlds: on the left, a silhouette of a traditional bank building and a faint U.S. dollar bill; on the right, a dark grid of blockchain-style nodes. The design symbolizes the tension between traditional banking and cryptocurrency

Tokenized Dollars vs. Banking: Data, Policy, and the Trillion-Dollar Fight

The GENIUS Act, which established the first federal framework for stablecoins, has become a flashpoint in the escalating tension between

Tokenized Dollars vs. Banking: Data, Policy, and the Trillion-Dollar Fight Read More »

Hotel revenue dashboard with metrics

Designing a Data-Driven Power BI Sales Dashboard with DAX-Powered KPIs

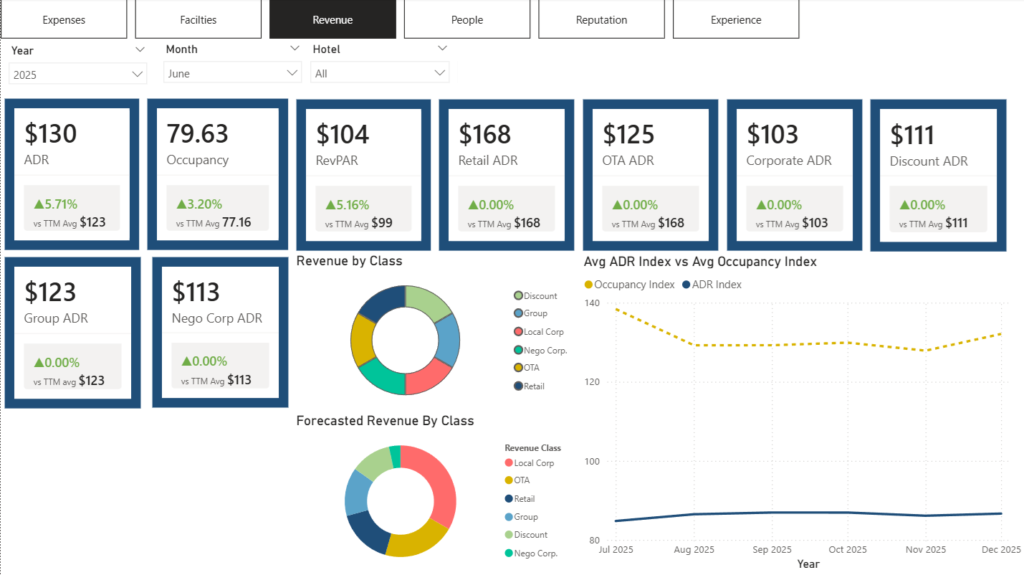
Working as a data analyst, you quickly find out that real-world data is never clean, and even after the arduous

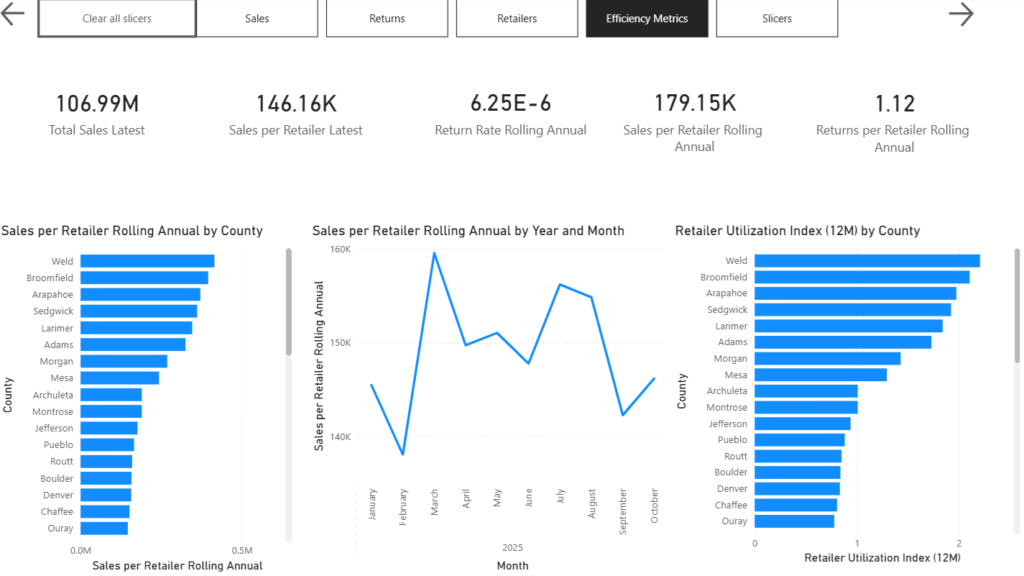
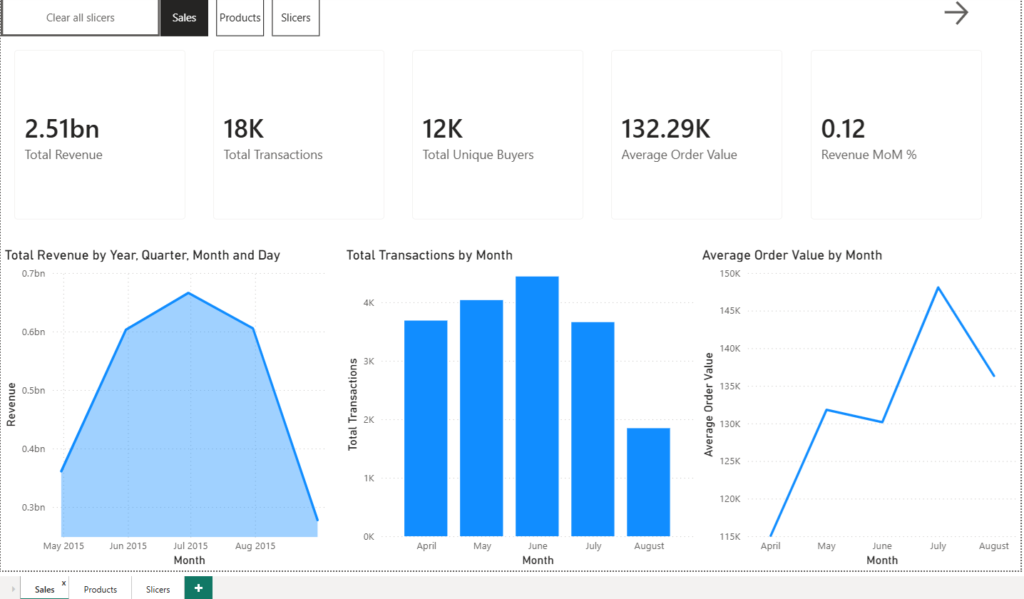
Designing a Data-Driven Power BI Sales Dashboard with DAX-Powered KPIs Read More »

  • Home
  • Services
  • About
  • Contact
  • Portfolio
Get A Quote
Get A Quote
logo black

2525 Arapahoe Ave Ste E4 # 1304 , C0 80302

info@signalboardanalytics.com

+1-720-340-8122

  • Home
  • Services
  • About
  • Contact
  • Portfolio

Copyright © 2026 Signal Board Analytics | Powered by Signal Board Analytics