
If you’ve heard about Power BI but aren’t sure what it actually does or whether your business needs it, you’re in the right place. This guide walks business owners through what Power BI is, what it costs, and whether you’re ready for it. You can also read more about why Power BI, in particular, is the best solution for most business use cases here.
What is Power BI?
Power BI is a Microsoft tool that connects to your existing data (your spreadsheets, QuickBooks, CRM, or point-of-sale system) and turns it into a live, visual dashboard you can check anytime. Instead of manually pulling reports or guessing at trends, you see your key numbers updated automatically in one place. Or, if you do not have a data infrastructure that will support or require live updates, you can easily manually update it every month or so (this process can be automated, of course)
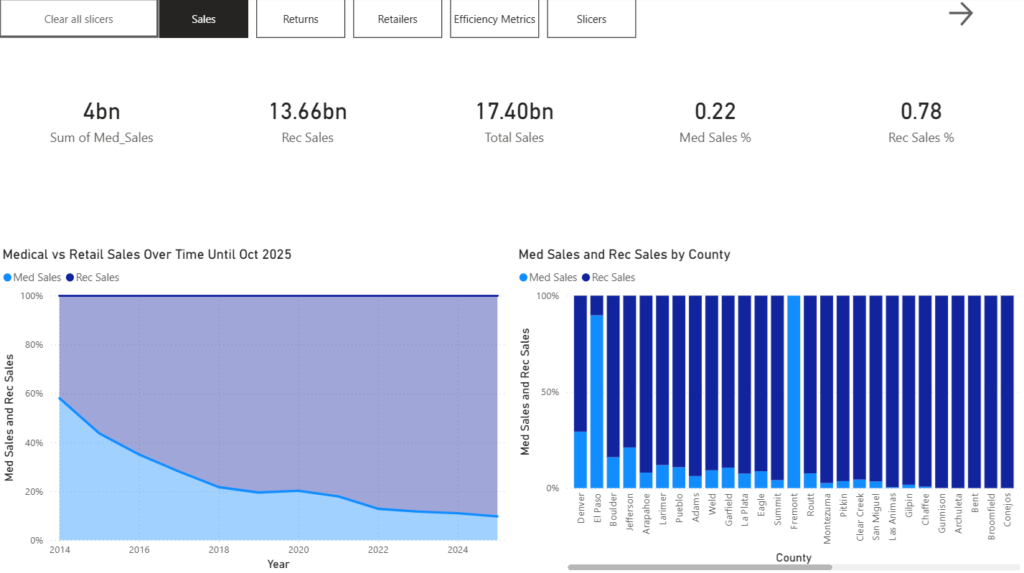
Think of it like a control panel for your business. Instead of logging into five different systems to piece together how last month went, you open one screen, and it’s all there: revenue, expenses, inventory, customer trends, whatever matters most to you.
Microsoft’s Power BI is one of the most widely used business intelligence platforms in the world, and it’s built to scale from a two-person shop to an enterprise. The fact that you are unlikely to outgrow it is one reason we recommend it to new clients so often.
What kinds of businesses actually use it?
97 percent of enterprise clients use it, so the short answer is: every kind. Power BI isn’t just for tech companies or large corporations. We work with Colorado businesses across industries, including:
- Retail and e-commerce — tracking sales by product, location, and season.
- Hospitality — monitoring occupancy, revenue per room, and staffing costs.
- Transportation and logistics — measuring on-time delivery, route efficiency, and fleet costs.
- Professional services — tracking project profitability, billable hours, and client retention.
Do I need a big IT team to use it?
No. That’s one of the biggest misconceptions we run into. Power BI is a self-service business intelligence platform designed for business owners and managers, not just analysts.
Most of our clients are checking their dashboards on their phones within a few weeks of starting with us. There’s no server to manage, no complex software to learn. Microsoft hosts everything in the cloud, and the interface is point-and-click.
That said, the initial setup is the technical part, and it’s worth getting right. Cleaning and transforming your data, building a proper data model, and ensuring your reports are actually accurate takes real expertise. A dashboard built on a shaky foundation will give you wrong numbers, and wrong numbers are worse than no numbers at all because they appear to come from a canonical source.
That’s exactly where we come in. We handle the initial technical heavy lifting: the data modeling, the connections, the logic behind the visuals, so that what you see on screen you can actually trust. And once it’s built, we train you and your team to use it confidently and independently, so you’re never dependent on us for the day-to-day.
Our goal is to give you a tool you own, not a service you’re stuck paying for forever. That said, many of our clients choose to stay engaged with us as their business grows: whether that’s adding new data sources, building out additional dashboards, or just having an expert in their corner as things change. We’re here for the quick fix and the long haul, whatever serves you best.
What data do I need to have first?
You don’t need perfect data to get started. This is probably the question we get most often, and the answer surprises people.
Most of our clients come to us with data scattered across spreadsheets and software they’ve outgrown. Some have years of sales data in Excel that’s never been analyzed. Others have a CRM they’ve been using inconsistently. A few are still running everything out of QuickBooks and a whiteboard.
None of that disqualifies you. Part of what we do is assess what you have and figure out the cleanest, most practical path forward. You don’t need to have everything organized before reaching out. We offer free data strategy sessions to help you get started here. If you dont have rich enough data to get value from a dashboard, then we will lay out a data collection plan to get there.
The one thing that does help is having a sense of what questions you want answered. “I want to know which of my products are most profitable,” or “I need to understand where I’m losing customers,” gives us a clear target to build toward. To address the former, we can easily drill down into product categories; for the latter, we would want to calculate churn rate. Often enough, we end up doing both, but the last thing we want is any components of our dashboard being underutilized, because that will slow down the rate of analytics adoption
How is Power BI different from just using Excel or Google Sheets? Or Google Sheets?
This comes up a lot. Excel and Google Sheets are great tools, and Power BI connects to both. The difference is what happens after the data is in there.
With spreadsheets, someone has to manually update the numbers, build the charts, and send the report. It’s time-consuming and easy for things to fall out of date. With Power BI, the data refreshes automatically according to the schedule you set. The dashboard is always current. Nobody has to manually do anything.
There’s also the matter of user friendliness. We recently completed an engagement for a national chain that already had analytics reporting built into its inventory tracking software. That was sufficient for their VP, who had a financial background and was comfortable navigating complex reports, but the goal was to get every department using data, not just the executive team. The warehouse staff, the store managers, the logistics coordinators: they all needed to be able to open a dashboard and immediately understand what they were looking at without a training course or a finance degree.
That’s one of Power BI’s biggest strengths. Because you control how the dashboard looks and what information is front and center, you can build a completely different view for each team that is simple, visual, and relevant to exactly what that person needs to do their job. The same underlying data, presented in a way that works for everyone from the C-suite to the floor.
Adopting Power BI will go a long way to developing a data-driven culture within your organization. That will make your business more resilient and often comes with a 15 to 25 percent increase in EBITDA, mainly because of increasing operational efficiency, but also sales and overall profit.
What does the process look like?
We keep it simple and low-pressure. Here’s how we typically work with a new client:
Step 1 — Discovery Call: A free conversation to understand your business, your goals, and where your data lives today. We ask a lot of questions and you don’t need to prepare anything technical.
Step 2 — Data Assessment: We take stock of your existing data sources and map out the fastest path to a clean, connected foundation. We’ll tell you what’s realistic and what a finished dashboard could look like for your specific business.
Step 3 — Build & Deliver: We build your Power BI dashboard and hand it off with everything you need to use it confidently. We walk you through it, answer your questions, and make sure you’re not left on your own. Most clients have a working solution in weeks, not months.
Is it affordable for a small business?
Yes, and that’s specifically why we built Signal Board Analytics around serving small and mid-sized businesses across North America. Enterprise consulting firms charge enterprise prices. We don’t.
We offer practical, right-sized solutions without the bloated price tag. Every engagement is scoped to what you actually need, not what looks impressive on a proposal. And because our business runs on word-of-mouth and repeat clients, it’s in our interest to deliver something that works in the long term, not just something that looks good at launch.
We’re happy to discuss pricing openly on a discovery call once we understand your situation.
What if I’m not ready for Power BI yet?
That’s a completely valid place to be — and we’ll tell you honestly if that’s the case on our discovery call. Sometimes a business needs to get its data into better shape before a dashboard makes sense. Sometimes a simpler solution is the right first step.
Either way, we’d rather give you the right advice than sell you something you don’t need yet. If Power BI isn’t the right fit right now, we’ll tell you what is and what it would take to get there.
Ready to take the first step
Schedule a free consultation, and we’ll give you an honest assessment of where your business stands and what a realistic path to a Power BI dashboard looks like for you — timeline, cost, and all.
No pressure, no jargon, no commitment. Just a conversation.