
Self-service business intelligence, web applications, and cloud computing were among the defining innovations of the 2000s and 2010s. Suddenly, small businesses could access software that had once been gated behind six-figure licensing fees and dedicated IT infrastructure. Tools that had existed solely to give large enterprises a competitive edge over other large enterprises were now available to small and mid-sized operations, allowing them to gain an asymmetric advantage over their competitors.
The 2010s and early 2020s saw BI platforms migrate to the cloud, consolidate through major acquisitions (Salesforce acquired Tableau in 2019; IBM absorbed Cognos in 2008), and race to incorporate artificial intelligence and machine learning. The market response has been enormous. The self-service business intelligence (BI) market was valued at USD 6.79 billion in 2024 and is projected to surpass USD 63.75 billion by 2037, growing at a compound annual growth rate of more than 18.8% (Zeoli).
The right platform will always come down to the use cases, the organization’s current tech stack, and culture, but more often than not, the best option is Microsoft Power BI for small or medium businesses. They created the industry standard for BI and continue to hold a firm grip on the enterprise market despite the rapidly changing, highly competitive BI landscape.
Market Position and Adoption
Power BI is used by 97% of Fortune 500 companies, holds a market share of over 30% in the analytics and BI platforms segment, and boasts over 30 million active monthly users across more than 100,000 organizations. In terms of sheer installed base, Microsoft drives the BI market and is the top vendor by number of installs, with 215,856 companies running Power BI (Electro IQ).
Perhaps most significantly, Microsoft has been positioned as a Leader in the Gartner Magic Quadrant for Analytics and Business Intelligence Platforms for 17 consecutive years, and has been positioned furthest to the right for Completeness of Vision and highest for Ability to Execute for 6 consecutive years(Microsoft 2024, 2025). No other BI vendor comes close to this track record of sustained market leadership.
1. DAX: Powerful Analytics Without the Complexity
At the heart of Power BI’s analytical capability is the programming language built into Power BI, called DAX (Data Analysis Expressions), which is very similar to Excel formulas. DAX is a formula language that allows users to define custom calculations, measures, and key performance indicators across their data models. What makes it particularly powerful for self-service adoption is its accessibility. The Query Editor is simple, even for beginners, and the natural-language Q&A interface makes it easy to create reports without much prior technical knowledge.
This is not a trivial advantage. Organizations worldwide have millions of employees already proficient in Excel. DAX builds on that existing knowledge base, dramatically lowering the barrier to entry for sophisticated analytics. A cornerstone of Power BI’s user-friendly design is the integration of DAX, which shares conceptual similarities with Excel functions, making it easier for users to craft complex calculations without a steep learning curve. Beyond formulas, Power BI’s Query Editor revolutionizes data transformation with a visual, step-by-step approach that eliminates the need for coding expertise.
More recently, Microsoft has used AI to further extend DAX’s reach. In October 2023, Microsoft released a feature that combines the power of the Azure OpenAI Service to generate quick measure suggestions for DAX, enabling report builders to create DAX measures using natural language rather than writing DAX from scratch (Microsoft 2025).
2. Drag-and-Drop Interface and Intuitive Report Building
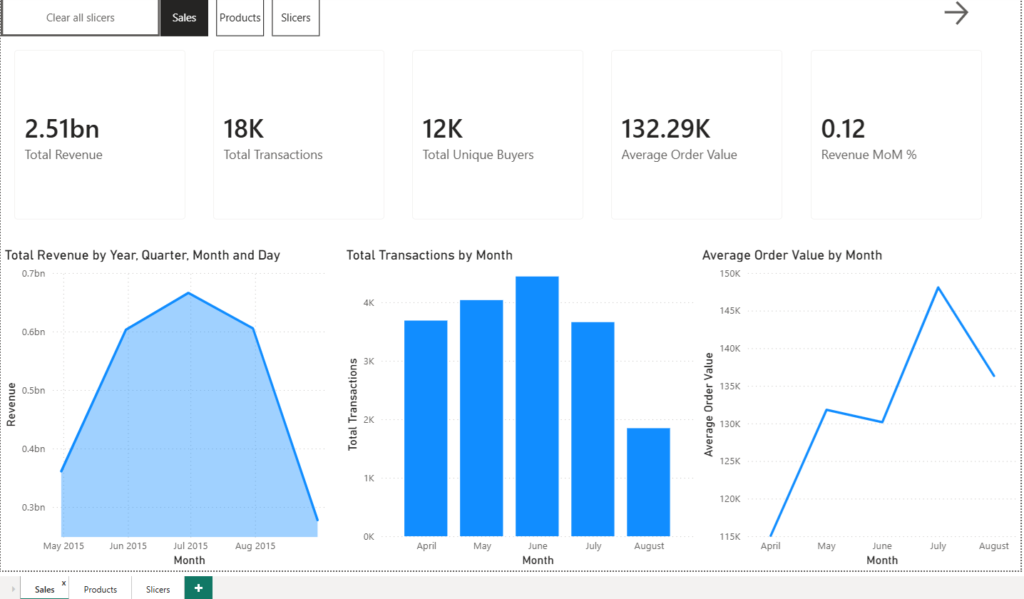
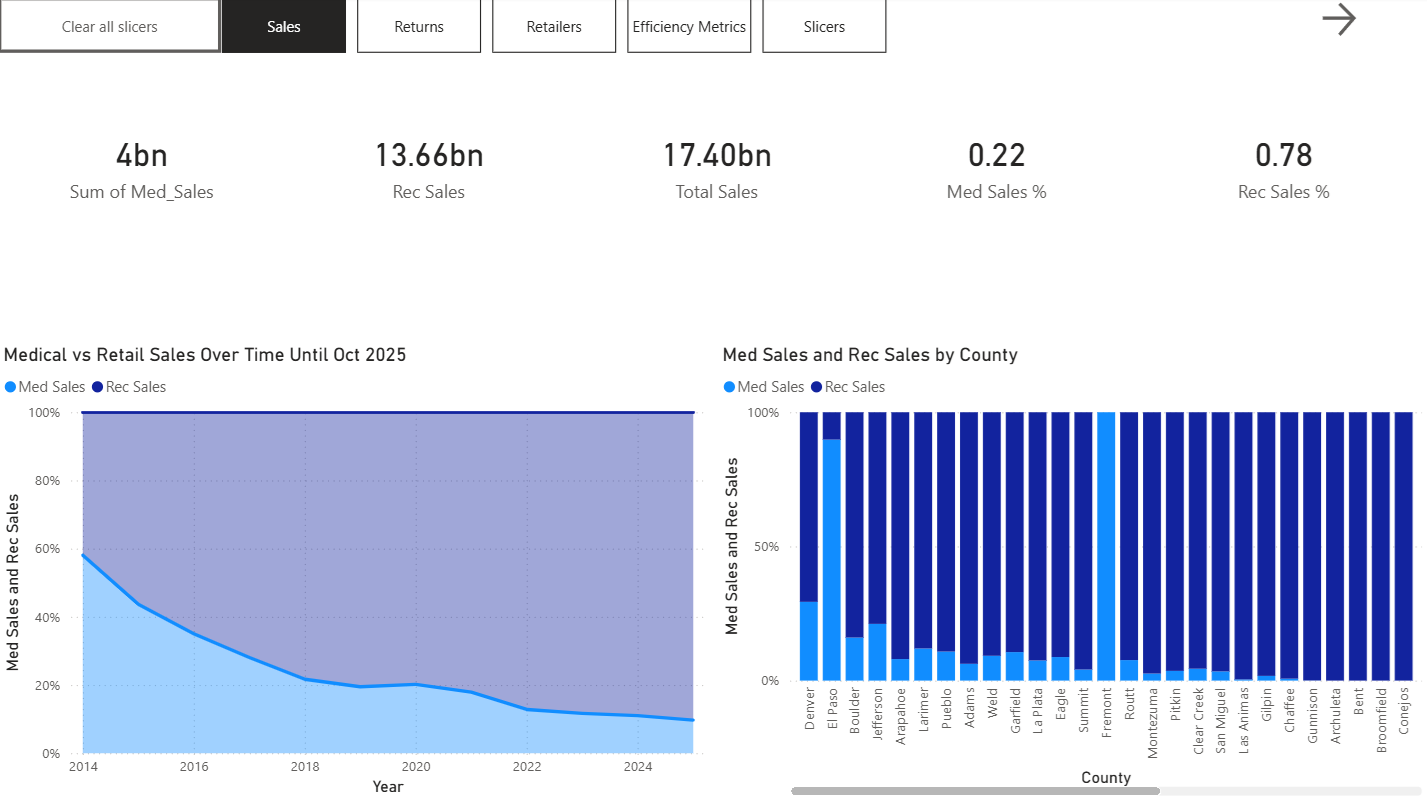
Self-service BI lives or dies on ease of use. A platform that requires a data science degree to operate is not truly self-service. Power BI’s drag-and-drop interface is among the most refined in the industry, enabling users to build interactive dashboards and multi-page reports in minutes. Anyone who has had to wrestle a Tableau dashboard into a certain format understands that this is not an insignificant advantage. It will save a developer’s hours of time and give them more creative control over the format. Both platforms allow you to customize with a brand style guide
Power BI’s data modelling capabilities allow users to create relationships between tables, define measures using DAX, and build sophisticated analyses. It offers a wide range of data visualization options, including charts, graphs, maps, and tables.
Approximately 72% of enterprises now use dashboard-based analytics to monitor operational performance, and around 57% are shifting from traditional spreadsheet reporting to automated reporting platforms. Power BI’s intuitive interface meets business users where they are, whereas tools like Tableau have a much higher barrier to entry.
3. Deep Microsoft Ecosystem Integration
For any organization already operating within the Microsoft 365 ecosystem, Power BI is a natural extension rather than a new adoption. This integration advantage is unmatched by any competitor.
Power BI offers tight integration with Microsoft 365 and Azure Active Directory, easy sharing via apps, and strong semantic modelling with DAX, with Row-Level Security that is straightforward to configure for per-user data access. Reports can be embedded directly in Microsoft Teams, shared via SharePoint, exported to PowerPoint, and refreshed automatically from Excel files stored in OneDrive.
Seamless Git integration for Power BI semantic models and reports enables teams to connect workspaces to Azure DevOps repositories to track changes, edit versions, and merge updates from multiple team members into a single source of truth that is instantly synchronized (Microsoft 2025).
In June 2024, Microsoft Power BI enhanced its integration capabilities by enabling connectivity with Oracle Databases using Microsoft Entra ID Single Sign-On tokens, meaning users no longer need to migrate data to other platforms for centralized access management, thereby simplifying data governance and enhancing security.. The integration story keeps expanding.
4. Community-Driven Development and the Monthly Release Cadence
One of Power BI’s most underappreciated competitive advantages is the velocity of its innovation, driven by one of the most active user communities in enterprise software. Microsoft received high marks from Gartner for its product vision and ability to execute it, with monthly, if not weekly, updates to Power BI (Pragmatic Works).
Every month, Microsoft publishes detailed release notes documenting dozens of new features, fixes, and community-requested improvements. Users vote on features through the Power BI Ideas forum, and the development team publicly responds to and implements community submissions. The result is a platform that evolves faster than any competitor and stays closely aligned with actual user needs.
Copilot in Power BI now enables users to ask questions, generate DAX calculations, summarize reports, and create visuals simply by describing what they need, with the new “chat with your data” feature allowing users to search for relevant insights and analyze trends across reports and semantic models without opening a specific report (Microsoft 2025)
5. Unbeatable Price-to-Power Ratio
Self-service BI is truly self-service only if an organization can afford to deploy it at scale. Power BI’s pricing model is a decisive differentiator. Power BI Desktop is completely free to download and use. Power BI Pro, which enables cloud-based sharing and collaboration, is available as part of Microsoft 365 E3 and E5 licences that most enterprises already hold, making the incremental deployment cost essentially zero for large swaths of the workforce.
Gartner cites Power BI as one of the key reasons for the drastic price reductions in analytics and BI platforms, noting that it is difficult to compete with the technical capabilities of both its free and paid versions, which, compared to other platforms, are very economical (Bismart).
Part Three: The Road Ahead
The self-service BI market is not slowing down. The global self-service BI market reached USD 10.1 billion in 2024 and is expected to reach USD 29.4 billion by 2033, exhibiting a CAGR of 12.6% (IMARC). As organizations continue to generate more data from more sources at greater velocity, the demand for platforms that allow every employee to extract insight from that data will only intensify.
Power BI’s trajectory positions it perfectly for this future. Its integration with Microsoft’s unified analytics platform (Microsoft Fabric) signals an evolution from a standalone BI tool to a full end-to-end data intelligence platform. AI capabilities via Copilot are being embedded throughout the product.

Conclusion
The history of self-service BI is, at its core, a story about removing barriers between people and insight. From the monolithic, IT-gated systems of the 1990s, through the first wave of visual analytics tools, to today’s AI-augmented, cloud-native platforms, every era has pushed the promise of truly democratised data a little further. Microsoft Power BI represents the current apex of that journey.
With a dominant market position, unmatched Microsoft ecosystem integration, the power and accessibility of DAX, an intuitive drag-and-drop interface, community-driven monthly releases, and an industry-leading price-to-value ratio, Power BI is often the best option for small and medium businesses looking to unlock the hidden power of their data. There are many specific use cases for other platforms, but taken as a whole product, Power BI is the closest thing to a one-size-fits-all business intelligence platform.
If you are interested in getting real-time business intelligence for your organization’s data, reach out to book a free data strategy session today.